
copy link
2 MINS READ
tech bro doing finance bro stuff

i checked my mail earlier today and discovered i had been billed for my spotify music subscription. i do not like being taken by surprise, and i have been procrastinating on sorting and documenting my subscriptions for the new year. this was the perfect reminder to get it done. what should have been a few minutes of work turned into a finance experiment, and i spent much of my day computing my annual subscriptions.
google keep is where i usually store my writings, but since this task involved numbers, i decided to use a proper spreadsheet. i started with chatgpt, asking it to create a simple spreadsheet with specific columns. the initial output was decent, but as i began to input the numbers, i realized my subscriptions were in three separate currencies; the naira, the euro, and the us dollar. this gave me many headaches, so i paused to think about it more carefully and develop a solid set of requirements.
requirements
the subscriptions should be computed in three separate currencies.
there should be a way to see the total spend in each currency.
the exchange rate should be dynamic and linked to a reliable source to fetch the most current data. (i didn't consider this a necessary feature, but it’s nice to know the current worth of your subscriptions).
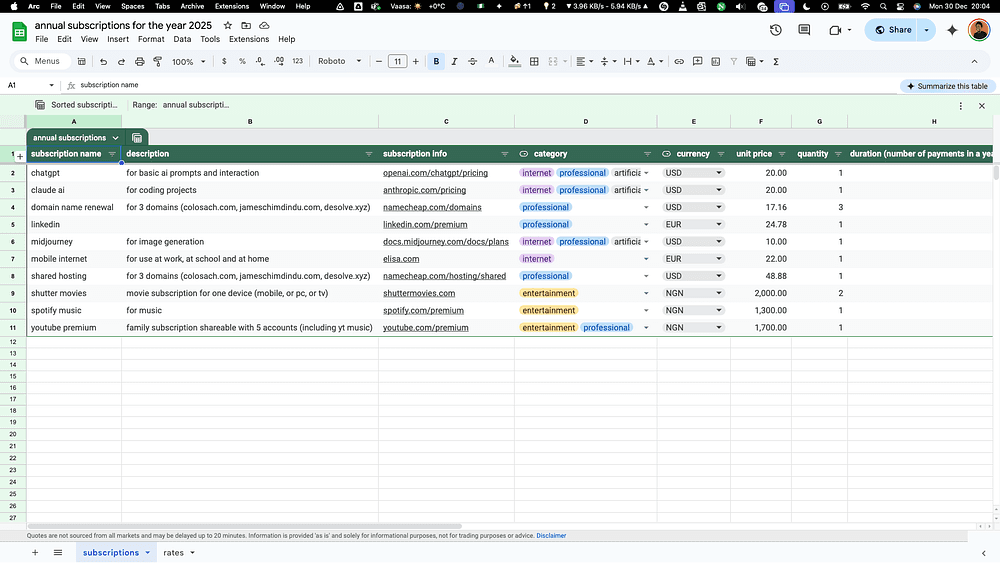
annual subscriptions table
i tackled the problem step-by-step, guided by chatgpt. since the subscriptions were in three separate currencies, i inputted the monthly subscription values as plain numbers (not formatted as currencies), created a dropdown column to select between the three currencies (usd, eur, ngn), and three new columns to show the converted amounts in each currency.
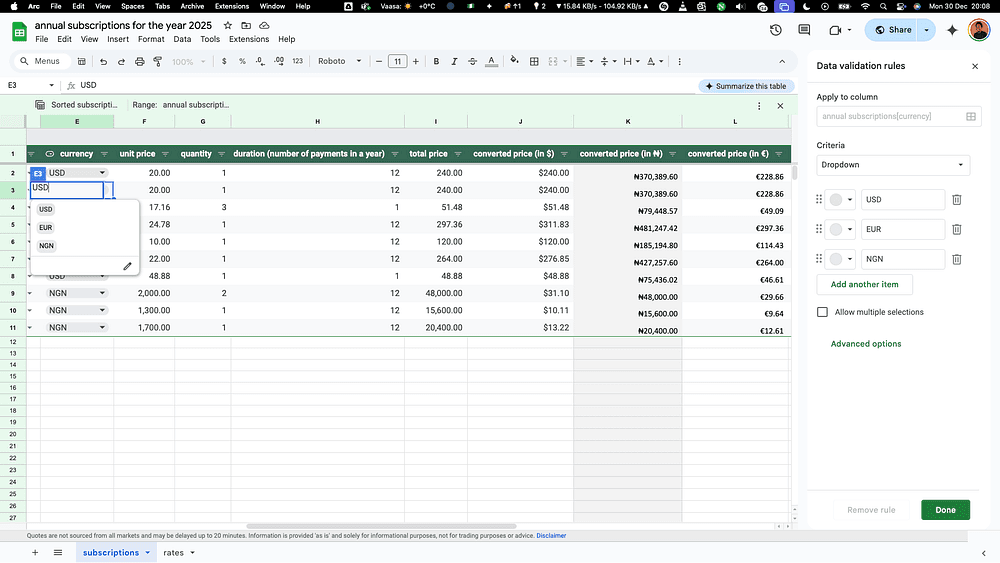
currency dropdown
manual calculations would have been very stressful, so i used formulas to compute the total annual price value (in column i) and handle the conversions into us dollars (in column j), naira (in column k), and euros (in column l).
for the second requirement, i didn’t stress over it too much because google sheets has a feature that displays the total value of any column selection. if that’s important to you, simply click on a column letter (say k), and you’ll see the total value in the bottom pane.
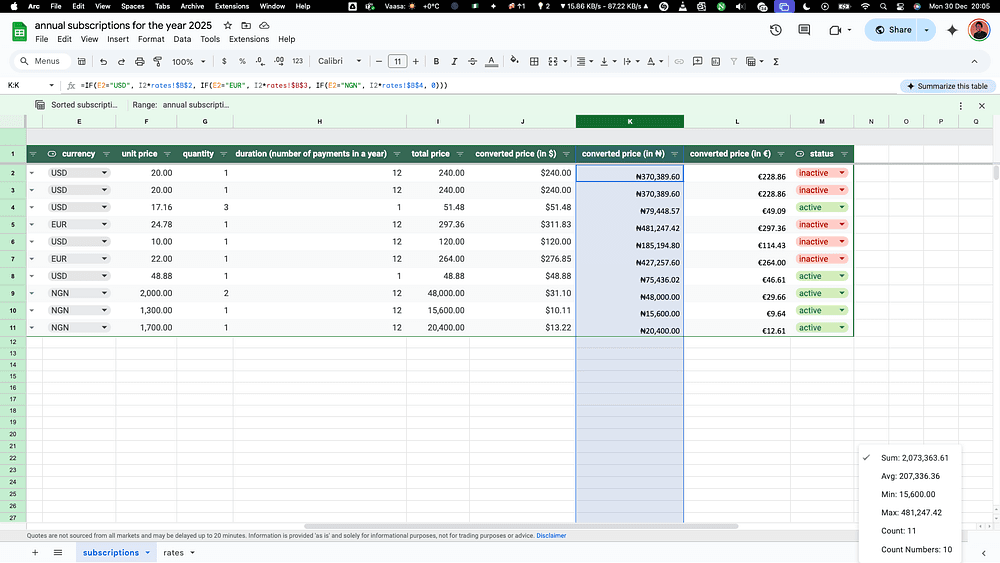
total value of column k in the bottom pane
to achieve a dynamic exchange rate, i used the google finance feature available only in google sheets; something i didn’t know existed before this experiment. take that, microsoft excel!
i created a separate sheet to house the exchange rates and used the google finance function to fetch the exchange rate conversions. i then applied these rates in a formula to dynamically show the converted amounts in each of the three currencies.

dynamic exchange rates using google finance
i won’t expose the formulas here, as this post isn’t focused on financial data analysis.
insights
i’m cancelling my spotify subscription. i love their wrapped feature, but i’ll make do with youtube music instead.
i was enthusiastic about adding more subscriptions to my active ones, but i now have to think twice. spending almost $1,500 annually on subscriptions needs to come with significant roi, and i’m not confident about that right now.
linkedin premium can wait, as can all my artificial intelligence subscriptions. there are tons of alternatives (like google’s imagefx instead of midjourney) that i’d rather use until i’m financially buoyant enough to afford those subscriptions.
if you’re like me and want to compute your annual subscriptions, make a copy of the file here. you’re welcome!